Services
BI & Data Analytics services
Data is most valuable when teams can understand it quickly and act on it. We build and customize dashboards that give leaders and operational teams faster access to the metrics that matter, from live job status to portfolio-level reporting.
Examples
BI & Data Analytics in practice
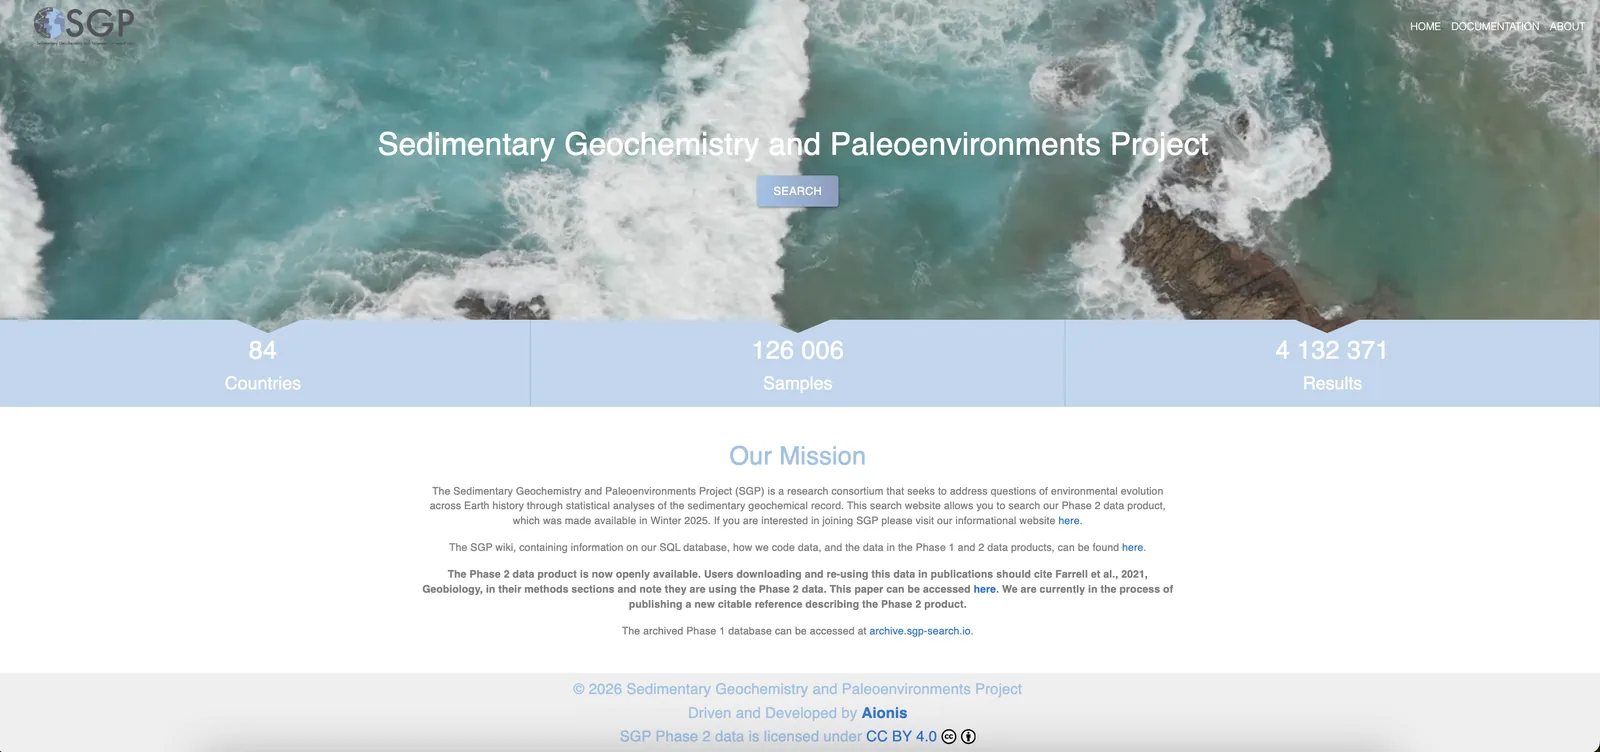
Scientific Research & Data
Data Hard to Find → Research at Hand
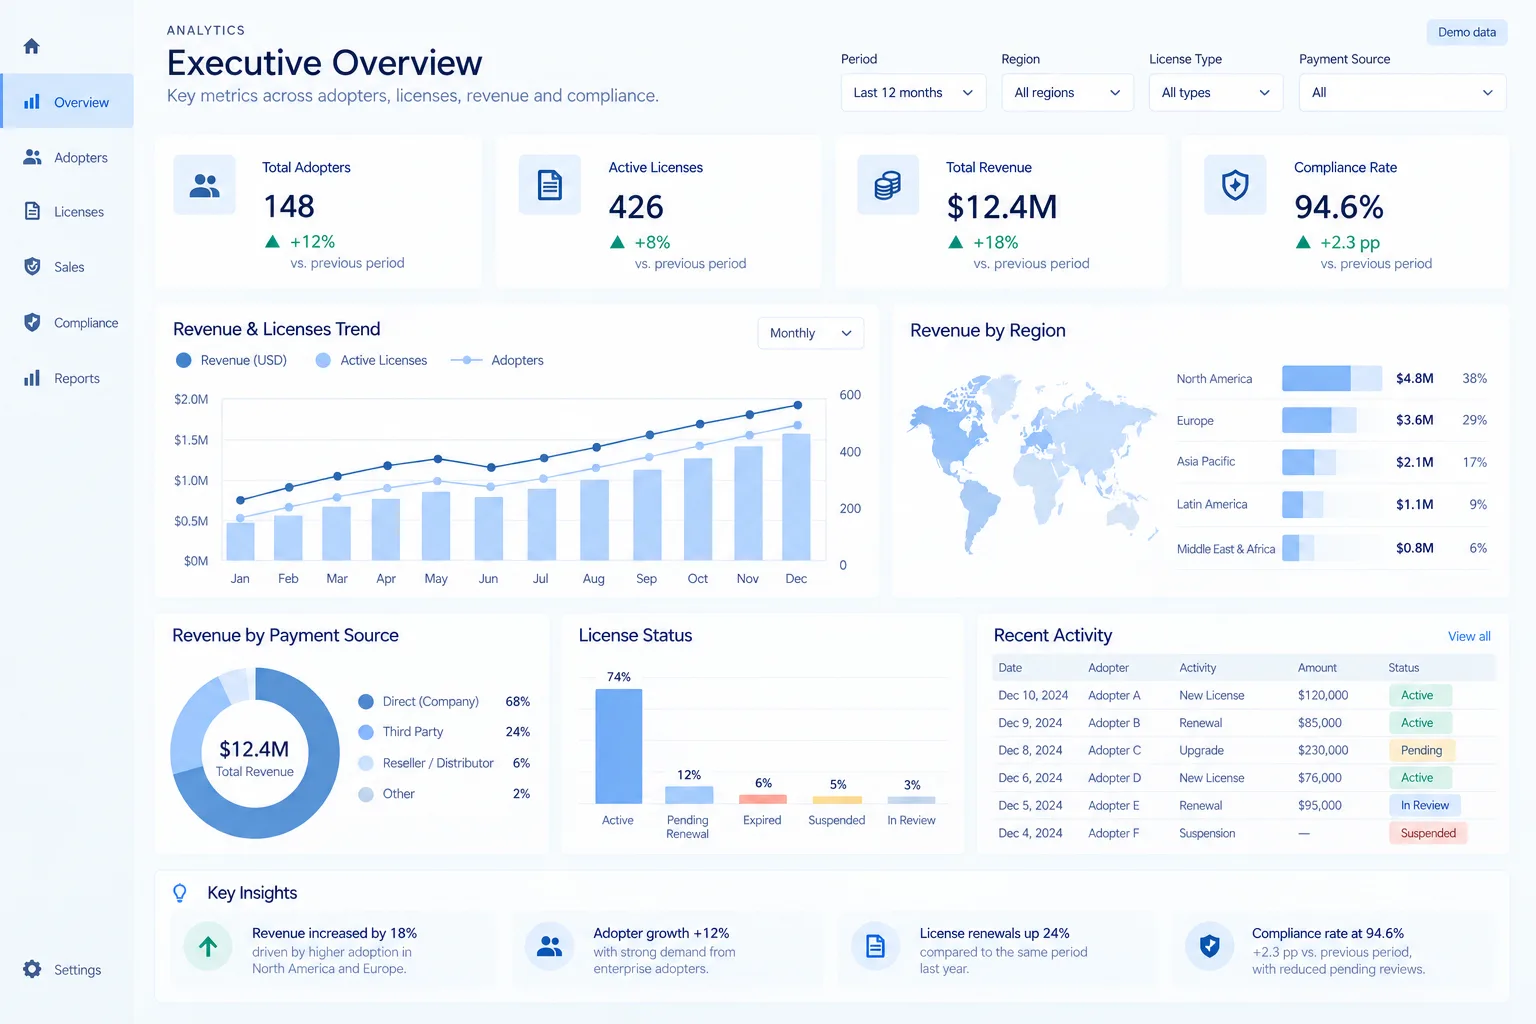
Consumer Electronics
One App, One Person → Built to Grow
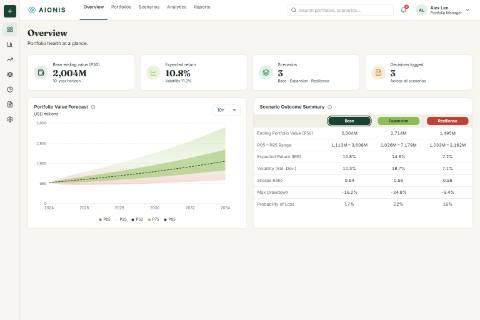
Scenarios
Financial scenario modelling: portfolio outcomes recomputed as you type.
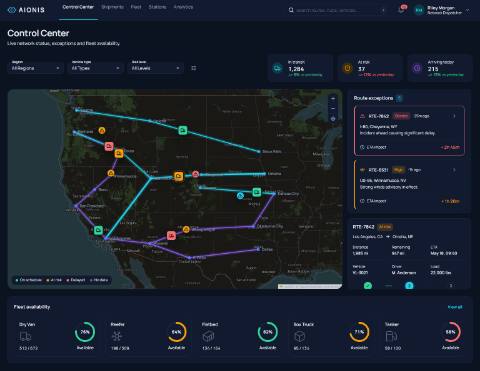
Control
Logistics control tower: network map, routes, exceptions and the fleet.
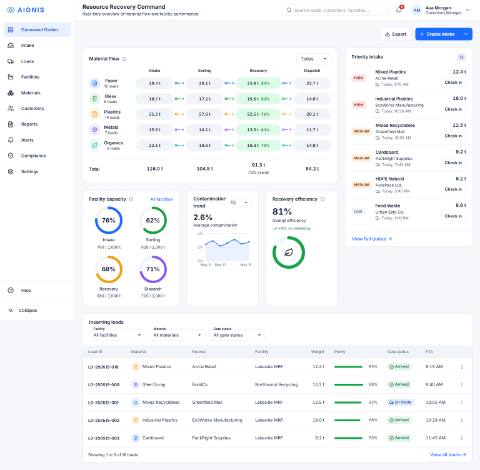
Recovery
Command center: inbound loads, material flow, facilities and KPIs in one place.
What you get
Scope of the engagement
Executive and operational dashboards in Power BI, Tableau or Looker Studio
KPI tracking and role-specific views
Real-time or near-real-time analytics
Data-source integration, preparation, models and pipelines
Search, filtering, maps and visualizations over large datasets
Client value
Typical outcomes
KPI visibility for leaders and operational teams
Reporting designed for faster decisions
Less time assembling reports by hand
Data storytelling that operational teams actually use
How we work
Five steps, a prototype review at each
- 01
Consult
A free conversation about the problem, the people involved and how the work runs today.
- 02
Scope
What to build first, the architecture and a plan with a budget you can hold us to.
- 03
Prototype
A working prototype early, reviewed with your team before the build goes further.
- 04
Build & launch
Short iterations with a review at each stage, then QA, deployment and onboarding.
- 05
Support
Monitoring, fixes and new features as the business changes.
Project-based. A fixed scope and price for well-defined initiatives.
Time & materials. A dedicated team for requirements that evolve.
You own the result: source code, infrastructure definitions and documentation are handed over, with no per-seat fees and no vendor lock-in.
Technologies
What we build it with
FAQ
Questions we hear most
Power BI, Tableau and Google Looker Studio, plus custom dashboards inside your own applications when an off-the-shelf tool does not fit.